|
Google Sheets
| #169
Google Sheets: Simplify Data Management with New Table Function!
(you can easily filter previous issues by application!)
Google announced the new Table functions for Google Sheets back in April and it has finally rolled out fully.
But I guess good things come to those who wait because man, is it a huge time-saver!
What is it?
If you’re anything like me, there’s a part of you deep down that absolutely would not let you start working on raw data before it’s properly formatted (if you don’t know what I’m talking about then…lucky you).
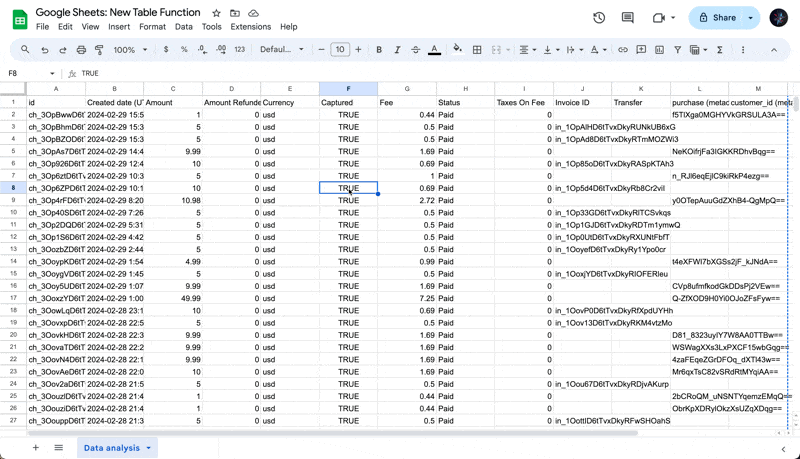
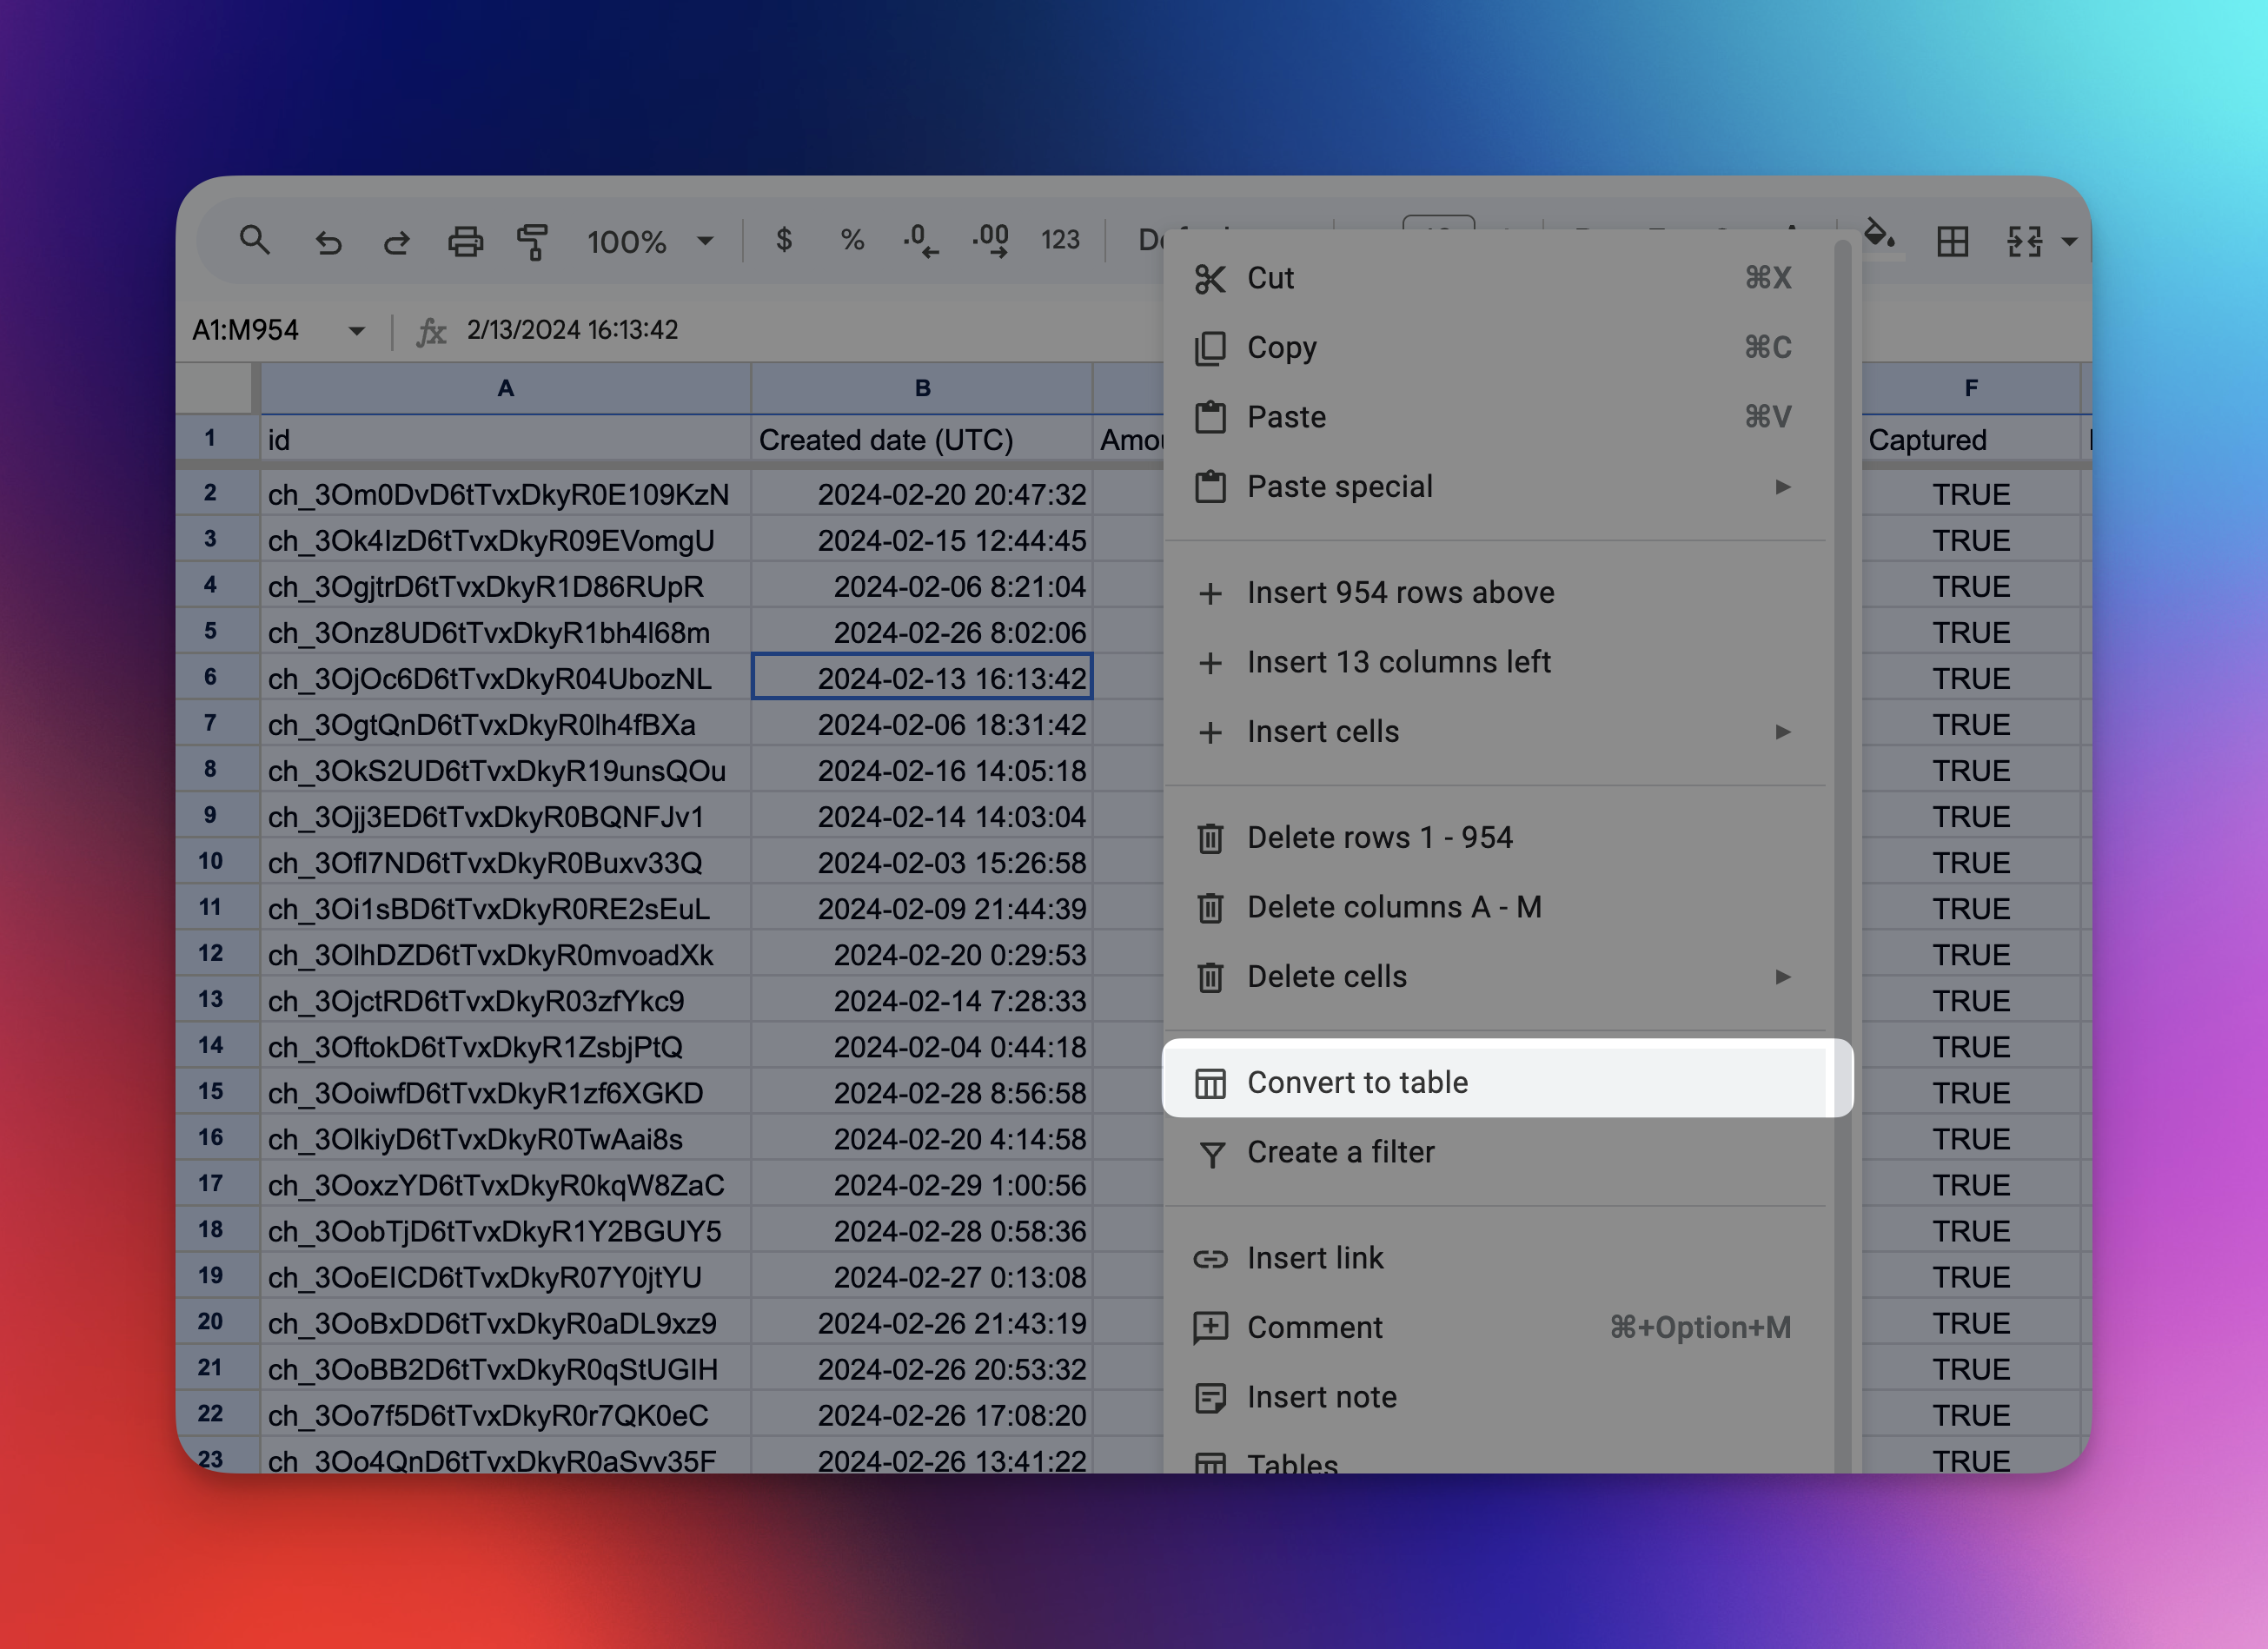
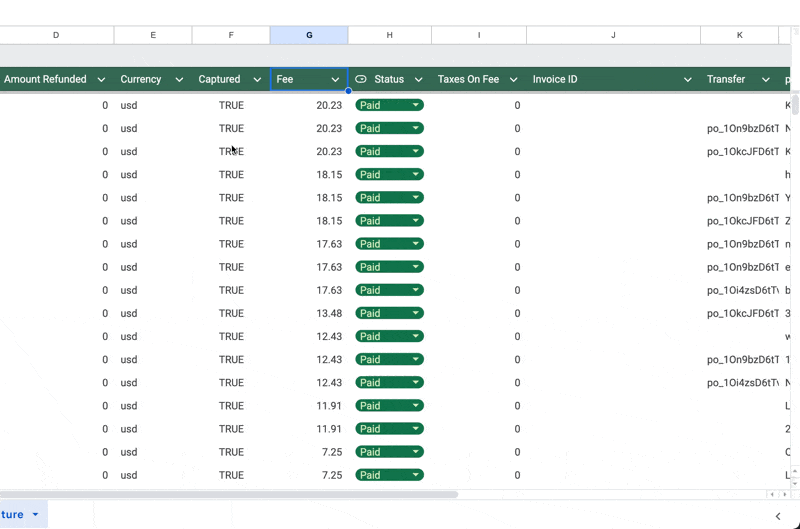
Now, whenever I import a .csv file into Google Sheets for example, I can simply CMD/CTRL + A (select all) > Right click > Convert to table, and 70% of the formatting would be completed.
Of course, I would still need to update the font, tweak column spacing, and change the color (the default colors are…pretty bad), but overall this has saved me a massive amount of time!
3 Things You Need to Know
Here are the 3 features I find myself using the most:
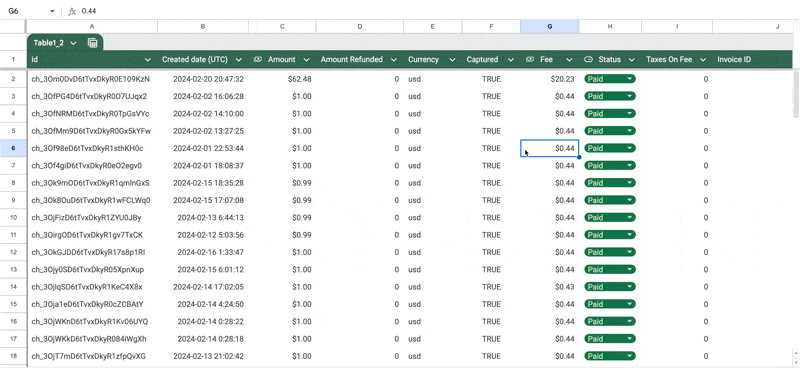
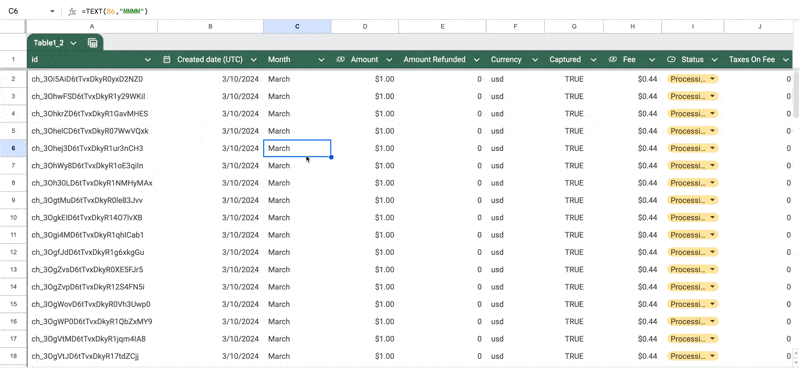
- Setting Column Types - Instead of selecting the entire column, I can just pick a column type (e.g. currency, dropdown) from the column header
- Group By Column - We can now easily aggregate our data into groups based on a selected column. I use this mainly to track projects by milestones (e.g. Milestone A has 20 tasks and can be grouped together in a single view).
- Save “Grouped” View - After grouping by column, you can easily save this view for future reference (sort of like a filtered view).
💡
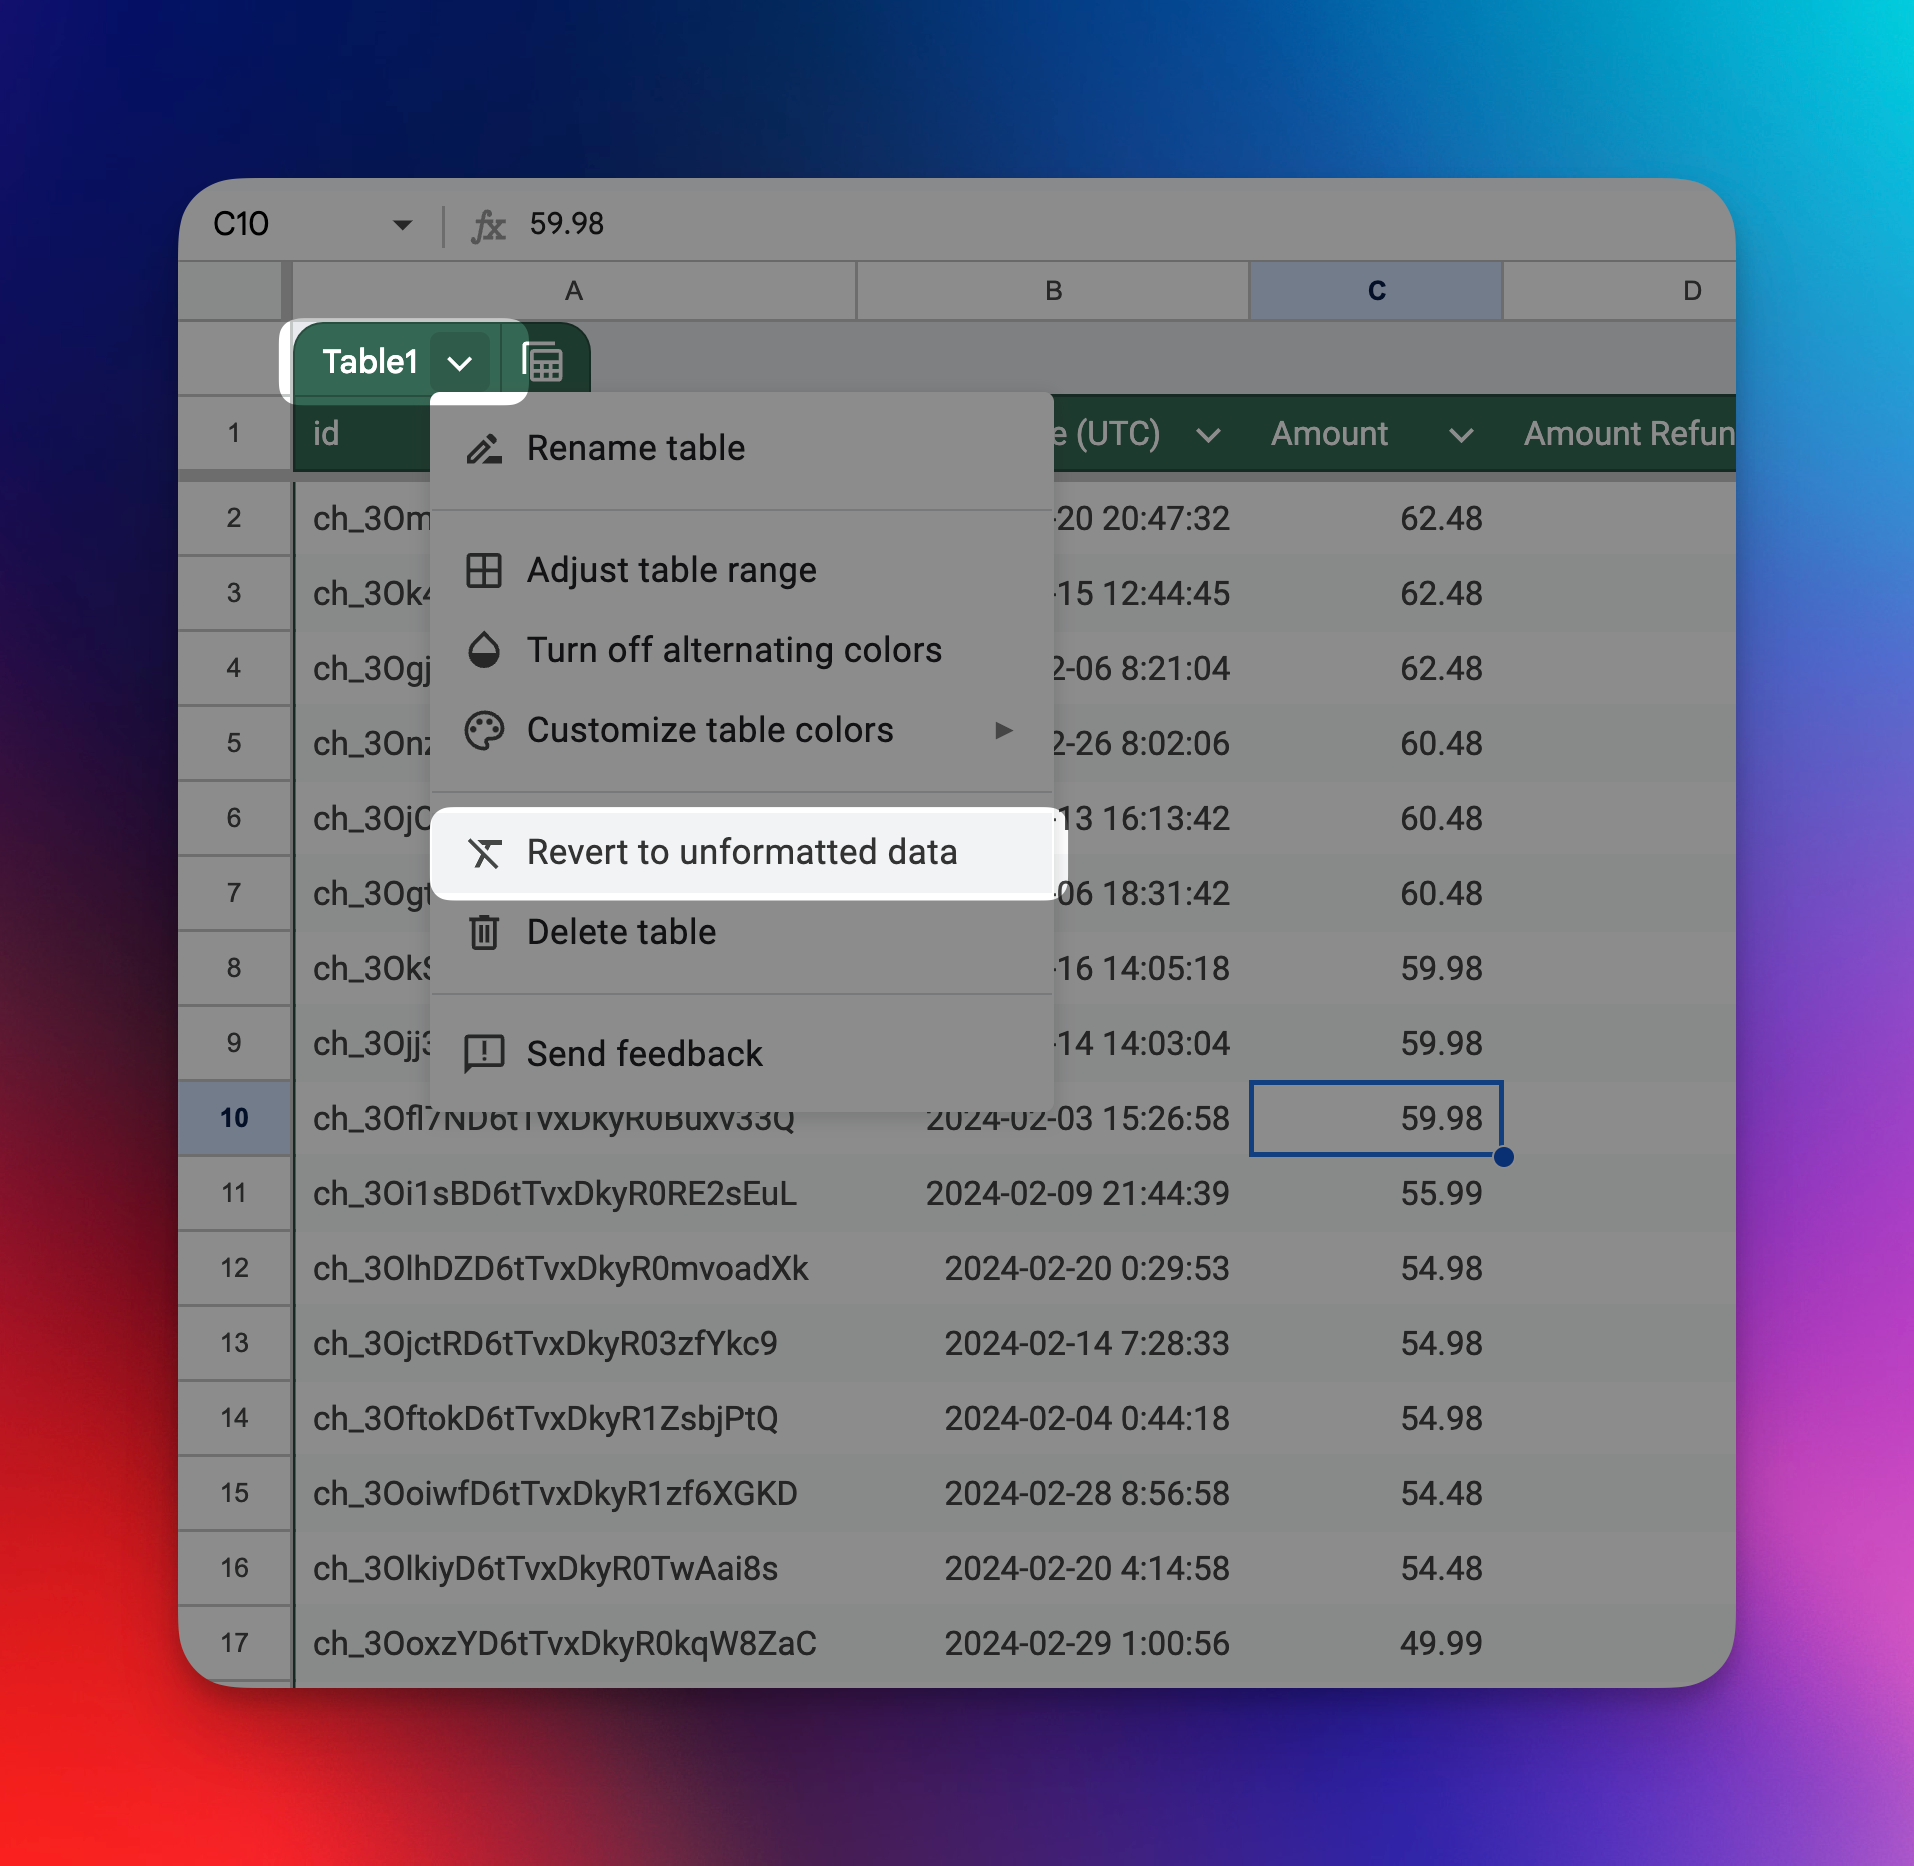
Pro tip: You can revert back to unformatted data by selecting the dropdown on the top left > Revert to unformatted data
Want to see more (or less) of this? Tap the thumbs up or down to let me know ⬇️
Want someone to be more productive? Let them subscribe here 😉
Thanks for being a subscriber, and have a great day!